![11 top customer engagement metrics to track [2024]](https://affiniv.com/wp-content/uploads/2024/09/customer-engagement-metrics-jpg-740x740.webp)
Customer engagement is critical for your business. But how to measure the same? Find out...
Customer engagement is critical for your business. But how to measure the same? Find out...
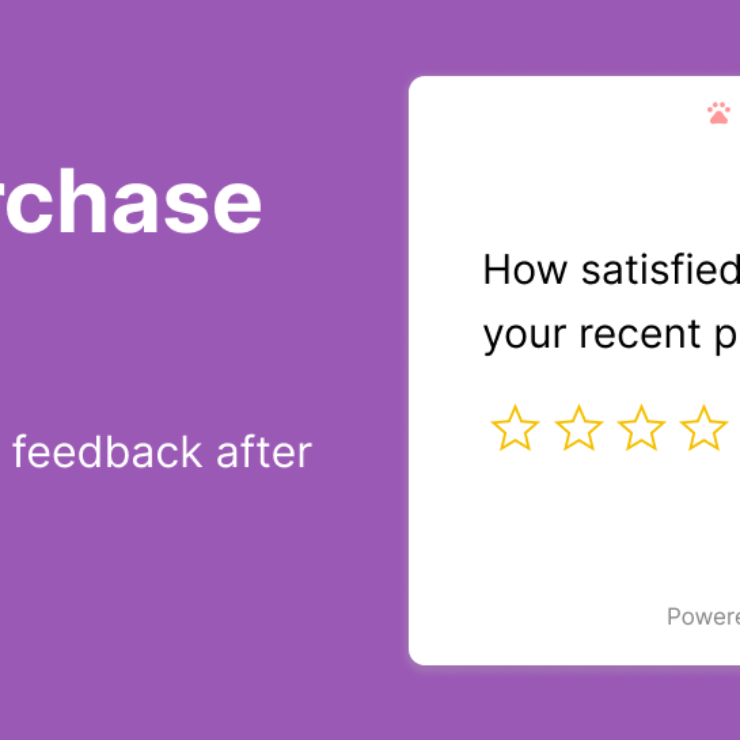
Want to collect customer feedback after their purchase? This detailed guide explains the Post Purchase...

Check out the top Jotform alternatives in this detailed guide. 1. Affiniv 2. Zoho Forms...
Looking to get feedback on your product? We have put together a list of research-backed...

Customer loyalty can be the cornerstone of revenue growth and profitability. This guide explores customer...
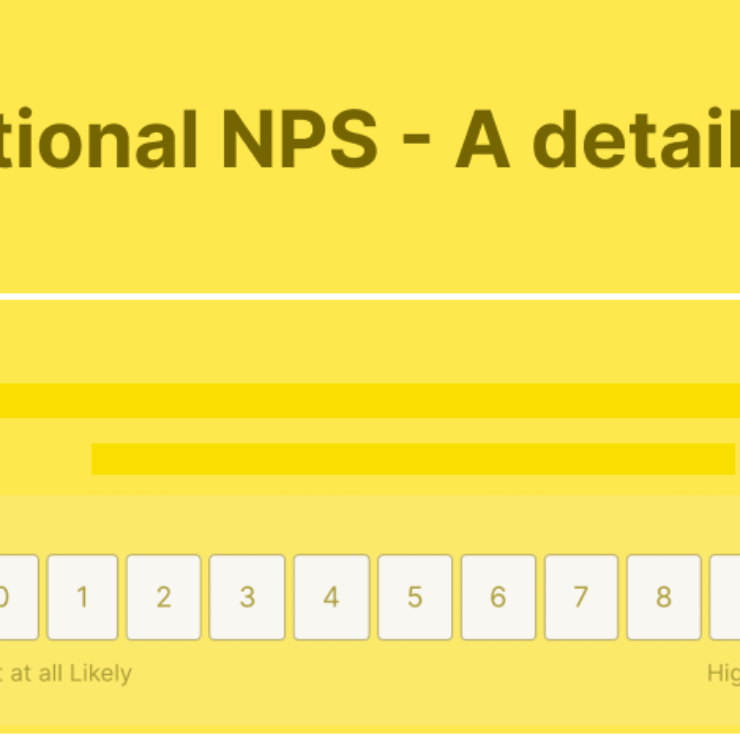
Transactional NPS or tNPS measures the customer experience for a transaction or interaction. A detailed...

Voice of customer (VoC) can help you elevate your customer experience. Discover a suitable voice...

Unlock the power of 5-star survey with our ultimate guide. Know what all about a...
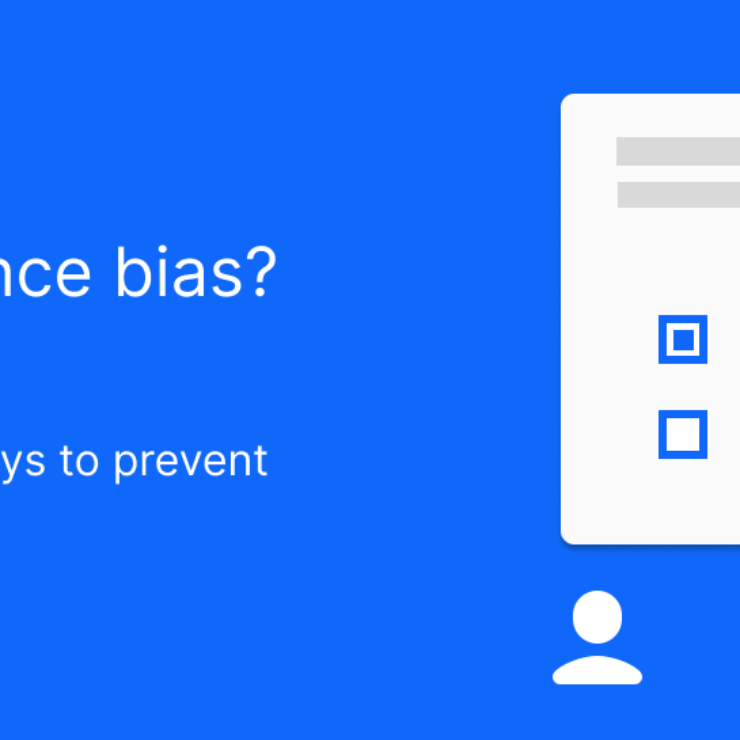
What is Acquiescence bias, Yes bias, or Confirmation bias? How does it impact survey results?...
Looking to capture customer sentiment quickly? Smiley face survey may get you a great response...