


Step – 4: What to do next? Analyze & Improve
Ok. Now you have a score! How do you know whether it’s good or bad? And what should you do next? Measuring and benchmarking your NPS is only the beginning. The real business lift comes from using the customer feedback to truly improve your business.What is a good Net Promoter Score? (Continued…)
While the above mentioned ranges for NPS can be used as guidance, there is no one-size-fits-all number for NPS. NPS varies widely across industries. For example, in the 2020 XMI customer ratings, report, Streaming Media and Retail industries had an average NPS of 28 and 25 respectively. Where as airlines, car rental businesses have average negative NPS. For software companies, the highest NPS captured in the study was 38 with the average of 14.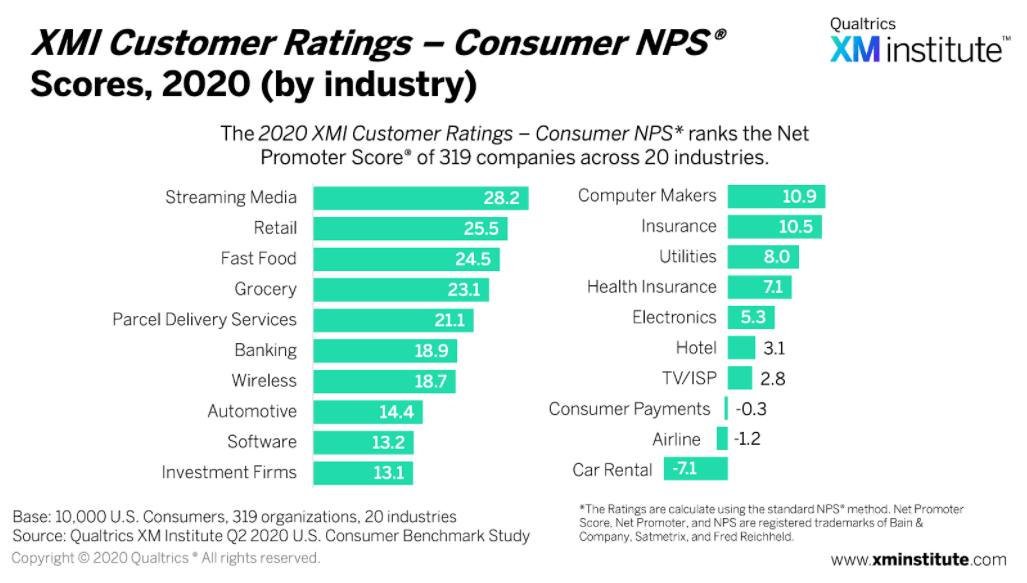 From the above picture it’s clear that within the industry there is a good deal of variation. This can be due to several reasons – number of suppliers, competitive dynamics, industry specific factors, geographical regions etc.
In case of software companies, for example, there are more options to choose from than it used be earlier. This results in higher expectations from a Software vendor and consequently a lower NPS.
There are also cultural biases to keep in mind. For example in some countries, it may be considered impolite to provide bad rating. As a result you may see more passives than detractors. Some industries like financial services, a loan denial may result in bad customer feedback. It’s important to benchmark yourself against your best in class peers as opposed to chasing a number.
From the above picture it’s clear that within the industry there is a good deal of variation. This can be due to several reasons – number of suppliers, competitive dynamics, industry specific factors, geographical regions etc.
In case of software companies, for example, there are more options to choose from than it used be earlier. This results in higher expectations from a Software vendor and consequently a lower NPS.
There are also cultural biases to keep in mind. For example in some countries, it may be considered impolite to provide bad rating. As a result you may see more passives than detractors. Some industries like financial services, a loan denial may result in bad customer feedback. It’s important to benchmark yourself against your best in class peers as opposed to chasing a number.Benchmark against your industry’s best (Not average)
It sounds obvious, but you should benchmark yourself with the best in your industry segment. And not the average score. For example, if you are a software company, you should aim for close to 40 NPS. Not the industry average, which is 14.Analyze the Why
Score is important, but the text feedback that you collect in the survey is the real goldmine. The descriptive feedback contains the “why” behind the score. This feedback must be shared across the team (both operating as well as executive) on a regular basis. An NPS tool like Affiniv has the option to tag each response and identify the important areas of improvement. You can analyze the feedback manually or use automated text analysis to discover the most common issues.Analyze score and feedback for each segment
To further analyze, you can segment responses by key attributes. For example: an ecommerce business may analyze NPS by city, product type, user demographic etc. A software/SaaS business can analyze NPS by attributes like country, language, industry, plan type, user role etc. If you find that customers in a certain city or industry giving you low score, then you can further analyze the issue and plan the action accordingly.Beat your own scores
As they say – a good NPS score is the one that is better than your last score. Collecting NPS should be a continuous exercise – should be done at least every month across your customer base. Every customer should be surveyed at least every 3 months to understand their feedback. You should compare your scores month-on-month or quarter-on-quarter to see how the scores are changing and take appropriate action.
Step – 5: Act and improve continuously
Companies which see success with their customer success program are generally committed to action. That is – measure NPS continuously and act on making your customer experience better by identifying insights. Customer excellence demands the right level of commitment at all levels – front line operators to executive. Sometimes it requires a mindset change for a business, which may be a little challenging but highly rewarding at the same time.