Last updated on:

How to implement NPS in your organization?
Step – 1: Design the NPS Survey
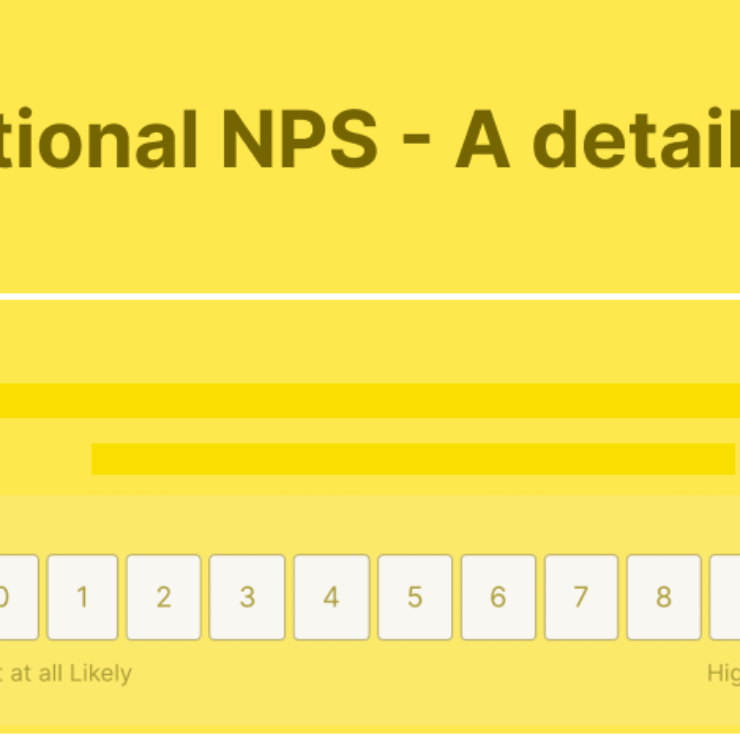
Start with the NPS question: The Main NPS question (also known as the “ultimate question”) asks the respondent about their likelihood to recommend the business/product/brand to friends/family/colleagues. The choice is an 11-point scale ranging from 0 to 10. You can frame your question according to your objective.

Follow-up question
To get feedback on why the respondent selected that score, typically, an open-ended follow-up question is asked. This question can be free-form text to capture the thought of the respondent behind the response. This response can then be analyzed either manually or automatically to identify the key improvement areas.
Follow-up question for free text response:
Additional questions: You can ask 2-4 additional questions apart from the 2 questions asked above. But it’s recommended to keep the number of questions around 4-6 to get maximum response.
Step – 2: Send the NPS Survey
Once you decide on the survey questions, it’s time to send the NPS survey to your respondents. There are multiple ways to send the survey. You can send the survey link via Email, SMS, WhatsApp, etc. An NPS tool like Affiniv lets you send the survey embedded inside the email. You can also embed the survey in your web pages to get a better response rate.

Step – 3: Calculate your NPS
As mentioned earlier, for NPS calculation, you need to use the formula:
[%Promoters – % Detractors]
Or this can be further simplified to

You can definitely use these formulas and calculate your NPS manually if your customer base consists of only 5 – 10 members. However, if the number exceeds (which will) you will have to resort to automation. We’d definitely suggest a highly responsive tool like Affiniv for the purpose to help you delve deeper into the numbers.
Anyhow, here’s a free NPS calculator to make the calculation easier for you. Give it a try.
NPS Calculator
Is your NPS score good enough?
NPS ranges between -100 to 100. So, the lower the number, the poorer the customer experience. A higher number indicates that you have a healthier business with happier customers. A business with a high NPS score would typically see 2 things that help it grow.
- Customers buy more and stay with the business for the long term. This results in higher revenue from existing customers.
- Their customers refer new customers to the business.
So, what is a good NPS score?
Inventors of the NPS system (Consulting firm Bain & Co.) suggest the following –
- Less than 0 (Negative NPS) – Not good (More detractors than promoters)
- NPS > 0 – Good
- NPS > 25 – Favorable
- NPS > 50 – Excellent
- NPS > 80 – World-class
Yet, these numbers can change according to the industry. For eg, 2 or 3 is actually a good score for the cable TV industry since the industry average is 1. So, there are various aspects to consider.
While the above-mentioned ranges for NPS can be used as guidance, there is no one-size-fits-all number for NPS. NPS varies widely across industries. For example, in the 2024 XMI customer ratings report, the Grocery and Retail industries had an average NPS of 34 and 33, respectively. Whereas Utilities and Car Rental businesses have an average NPS of 16.
NPS Industry benchmarking

From the above picture, it’s clear that within the industry there is a good deal of variation. This can be due to several reasons – the number of suppliers, competitive dynamics, industry-specific factors, geographical regions, etc.
In the case of Software Firms, for example, there are more options to choose from than before. This results in higher expectations from a Software vendor and consequently a lower NPS. In some industries, like Insurance, a claim denial may result in bad customer feedback.
There are also cultural biases to keep in mind. For example, in some countries, it may be considered impolite to provide bad ratings. As a result, you may see more passives than detractors. It’s important to benchmark yourself against your best-in-class peers as opposed to chasing a number.
Step – 4: What to do next? Analyze & Improve
Ok. Now you have a score! How do you know whether it’s good or bad? And what should you do next? Measuring and benchmarking your NPS is only the beginning. The real business lift comes from using customer feedback to truly improve your business.
Analyze the Why: The score is important, but the text feedback that you collect in the survey is the real goldmine. The descriptive feedback contains the “why” behind the score. This feedback must be shared across the team (both operating as well as executive) regularly. An NPS tool like Affiniv has the option to tag each response and identify the important areas of improvement. You can analyze the feedback manually or use automated text analysis to discover the most common issues.
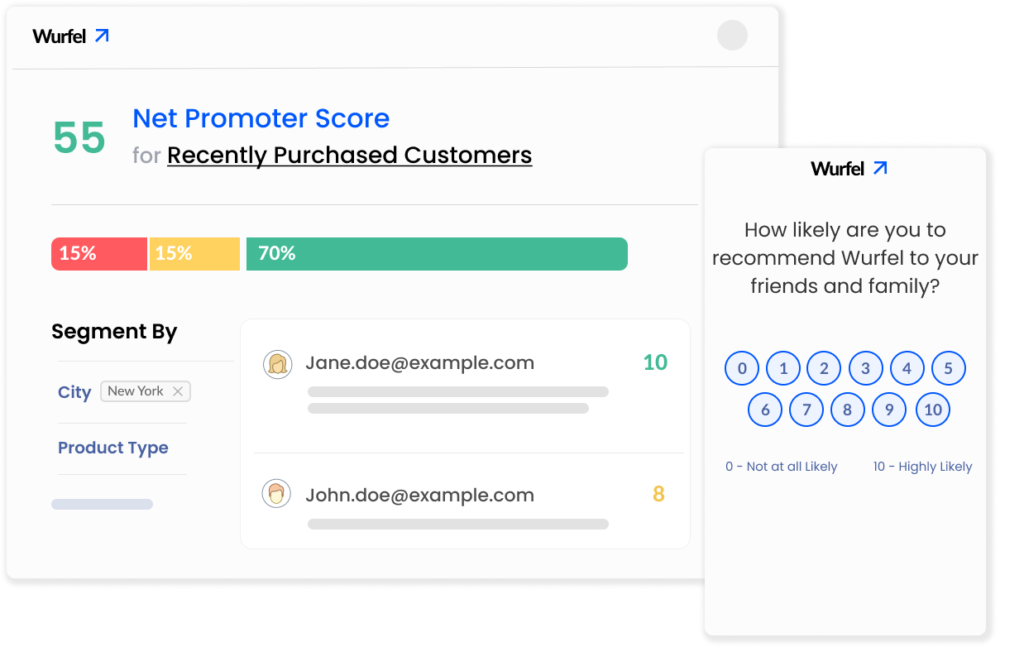
Analyze score and feedback for each segment: To further analyze, you can segment responses by key attributes. For example, an eCommerce business may analyze NPS by city, product type, user demographic, etc. A software/SaaS business can analyze NPS by attributes like country, language, industry, plan type, user role, etc. If you find that customers in a certain city or industry are giving you a low score, then you can further analyze the issue and plan the action accordingly.
Beat your own scores: This is a valuable point. As they say, ‘a good NPS score is the one that is better than your last score.’ Collecting NPS should be a continuous exercise – it should be done at least every month across your customer base. Every customer should be surveyed at least every 3 months to understand their feedback. You should compare your scores month-on-month or quarter-on-quarter to see how the scores are changing and take appropriate action.
Step – 5: Take actions, Close the Loop, and Improve Continuously
Companies that see success with their customer success program are generally committed to action. That is – measure NPS continuously, gather feedback, analyze it, and act on it to close the feedback loop. This is where many companies lack. Just conducting NPS surveys is not going to take you anywhere. You need to close the loop. Here’s what Rob Markey, the leader of Bain & Company’s Global Customer Strategy, has to say about closing the loop
Closing the loop
Your NPS programs should be a continuous exercise to improve customer experience. Conducting NPS surveys once in a blue moon won’t bring the desired results. It’d be just a waste of time.
So, here’s what you should keep in mind when dealing with feedback from NPS.
Gather, Analyze, Respond, Act, Improve. REPEAT.
How to Improve NPS [Proven Strategies]?
As we mentioned before, NPS improvement starts with closing the loop. And the strategies mentioned below are more or less part of it.
Boost the Brand Image
Involve in powerful strategies to promote your brand. The best way would be to ask your customers, especially promoters, to facilitate your campaign through word of mouth, online reviews, and referrals. You can also encourage them to do so by giving them offers and incentives as a token of gratitude for participation.
Follow-up with Detractors and Passives
Follow up with detractors and passives by sending them personalized messages and finding the reason behind their score. Address them and provide instant solutions. Make sure you let them know of this. Also, engage with them often, but don’t go overboard with it. You need to give them their space as well. All this will help you build a good relationship and convert them into your loyal promoters.
Engage with Promoters
You shouldn’t forget the promoters, your loyal customers who took the time to give a great rating and convey the desire to recommend your brand. So, engage with them regularly, offer them incentives, and make them feel cared for.
Bring down the average resolution time
Prompt solutions are always preferred by customers. So, your team as a whole should put in the effort to handle issues quickly and reduce the average resolution time. If it takes time to solve the issues, then provide the customers at least with a temporary solution, but do let them know of it.
Final Thoughts
Customer excellence demands the right level of commitment at all levels – front-line operators to executives. Sometimes it requires a mindset change for a business, which may be a little challenging but highly rewarding at the same time.