Last updated on:
Summary
What is a good net promoter score to have? How to benchmark it? What is a bad NPS? Find out how you can determine if your NPS is good or bad. Take a read.
What is a good NPS score? Ideally, the answer to this would be
– Anything greater than 0 is considered good.
– If it is greater than 25, it is quite favorable.
– Your NPS is more than 50? Excellent!
– Or have you scored more than 80? Almost perfect.
BUT…here’s the catch. There are cases where negative NPS scores are considered good and some others where scores like 25 or even 30 are not good enough. Why is that so? Is your business one amongst them? Read to find out.
‘What is a good NPS score?’
‘Is my company faring well, when it comes to NPS?’
‘What is the NPS benchmark my business should aim for?’
Being one of the most effective CX metrics, you just can’t ignore NPS, can you? Of course, you will have tons of questions, and we are here to answer them.
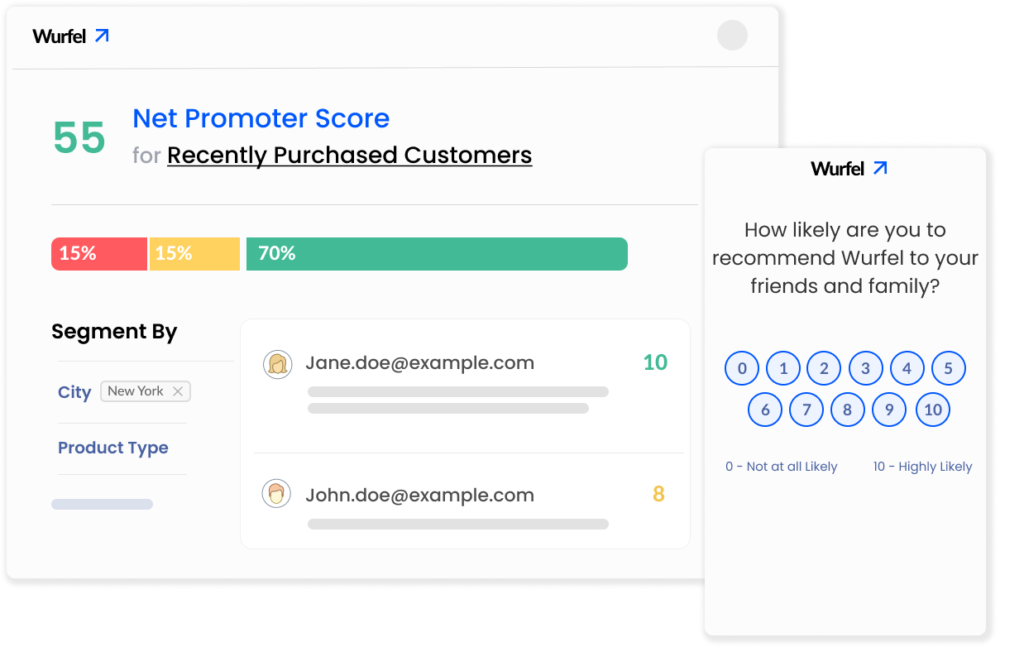
NPS surveys can help you find many significant answers about customer loyalty. You can identify the happiest as well as the most dissatisfied customers with just a single question.
‘On a scale of 0 -10, How likely are you to recommend our product/service to your family or friends?’
It’s that simple, yet it speaks volumes. It has helped organizations improve the experience, reduce churn, and build longer customer relationships, which has obviously been reflected in their revenue.
However, to get these results you need to take timely actions, and to act on time, you need to know how good or bad your overall NPS score is! Let’s find out.
Table of Contents
The Highest and Lowest Possible NPS Scores
Your NPS can be anywhere between -100 and +100.
If you get a -100, then it says that each one of your customers is extremely unhappy with your service, i.e, they are detractors. When that’s the case, there’s not a moment to lose! You need to act instantly to win them back!
Obtaining +100 means, every one of your customers is happy with your service, i.e they are your promoters! They will recommend your product/service to anyone. Now, don’t get your hopes high, this could only happen in an ideal world!
A Quick Look at the Respondents
Before we dig deeper into good and bad NPS scores, let’s take a look at the respondents. The NPS survey respondents are categorized into three groups, based on the score they give you.
Detractors: The respondents who score in the range of 0-6. They are unhappy with your brand and will not recommend you at all.
Passives: They score you a 7 or 8. They are just satisfied, not happy with your brand, which means that they can easily leave you for better offers.
Promoters: They score you a 9 or 10. They are super-happy and will loyally recommend your brand.
Use Affiniv’s Free NPS calculator to quickly calculate your NPS.

What is a Good NPS Score?
According to Bain & Co., the inventors of NPS,
- An NPS score less than zero, i.e a negative NPS score is not considered good. It means that you have more detractors than promoters.
- Anything greater than 0 is considered a good NPS score
- An NPS score greater than 25 is favorable while more than 50 is excellent
- Is it above 80? Then, your NPS score is close to perfect!

However, there are cases where negative scores are good, and scores like 25 aren’t that great. So, NPS scores are subject to your business. There are two ways to think about it.
Absolute and Relative NPS
The impact of your net promoter score can be found out depending on the type of method you use.
Absolute NPS: In this method, you can compare your score based on a generalized standard wherein any score above 0 is considered good and that below 0 is considered bad.
Relative NPS: Relative NPS strives to benchmark your NPS score against companies from your same industry or in other words, your competitors.
So, which NPS Method should you choose?
Let’s say you are a B2B software company with an NPS score of 11. When you largely compare it with industries in general, you will see that industries like health insurance, etc. have just 7.1 as their score. It will appear as if you have a good NPS score. But at the same time, if you compare it relatively with the competitors of your industry, you will find that the average NPS score is 30.
Well, the aforementioned example proves that absolute NPS may not give away much when compared to the relative method. Therefore, it is very important to know how to benchmark your NPS scores with those of your industry competitors.
NPS Benchmarks By Industries [2024]
The objective is to improve your score with each NPS survey, but how much effort should you put in and how aggressive should to be? All this comes down to benchmarking your NPS against companies in your industry. It is arguably the most effective way to find where you stand. Here’s a list of the average NPS score for various B2B and D2C industries.

Note that the average NPS score for Hotel and Airlines is 22, so anything above it, like 25, is considered great! Whereas the same score in the Retail or Grocery industry is considered too low.
What are the factors that affect NPS Benchmarks?
Now, benchmarking against your industry competitors is good, but it can also vary across countries. So, you shouldn’t depend entirely on the benchmark alone. You need to know when this is beneficial for your business and when to discard it. Here are 4 factors that can affect NPS benchmarks according to experts:
Innovation in the Industry
The market is evolving at a quick pace. Brands are looking for new and intuitive ways to serve customers. Breakthrough innovations and ideas can drive pivotal changes in the NPS benchmarks.
For instance, normal camera smartphones used to dominate the mobile manufacturing market. But when the ‘selfie culture’ started to rise in popularity, people found it difficult to click selfies with the back camera. That’s when mobile manufacturing brands started introducing smartphones with front cameras, and it became an instant hit. This was a revolutionary thing back then.
Similar breakthrough ideas can bring a drastic change in the industry and therefore affect the NPS scores as well, depending on the popularity.
The intensity of the Competition
Benchmarking NPS tends to be more successful in areas with high competition where you can compare the scores since you function based on similar characteristics. This isn’t the case when it comes to industries with low competition.
Let’s take Tesla for example. The NPS is 96. Even though the brand is great and caters to the premium market, the reason for this high score can be attributed to the low competition. There aren’t many brands to compare the performance with.
Tolerance Level and Easiness to Switch
Different industries have customers with different tolerance levels. It is usually seen that non-SaaS businesses have higher tolerance when compared to SaaS. While it is easier for customers to switch brands when it comes to SaaS, it isn’t always easy for them to switch to non-SaaS companies.
Let’s take an example. SaaS tools offer various pricing models on a subscription basis. There could be a free model, a basic model, or a premium model on a monthly or annual basis. So, if you come across a not-so-satisfactory experience, you can switch it almost immediately, within a month or at the most a year.
Now, what if you bought a brand new motorcycle? Would you be able to do the same? No, because of the expense involved and switching to another motorcycle would mean a financial loss. So, you tend to tolerate a few troubles with the motorcycle.
Due to the low tolerance and low switching barriers, it is comparatively hard for SaaS companies to gain loyal customers. So, all this can affect the overall NPS score of not just a particular SaaS business, but the industry’s as a whole.
External Factors
External factors like economics, politics, and current affairs can also affect the NPS scores of industries, especially those among the likes of banks, investment management, insurance companies, etc.
What are the different ways to benchmark your NPS Score?
While benchmarking your NPS score to your competitors is a great way to find out whether your score is good or bad, it can also depend on some factors like the ones we mentioned earlier. Let’s see what are the other ways (apart from comparing with industry competitors) in which you can benchmark your NPS score.
Benchmark against the Regional Average
If you are a business catering to global standards, you might have known by now that cultural and regional differences can impact customer behavior and thus loyalty and satisfaction. So, the NPS surveys for the same product can give different NPS scores in different countries. Therefore, it is important to benchmark NPS on a regional basis as well.
Benchmark according to survey mediums
It is a known fact that one can send NPS surveys through various mediums or channels like email, in-app, SMS, and more. The survey response will vary according to the channels.
For instance, email surveys get higher responses compared to SMS and in-app surveys. However, the responses from an in-app survey tend to be more accurate because the NPS survey pops up after the user experiences your app or website.
Owing to all these reasons, it is very much important to collate and compare NPS scores from different channels to arrive at a fitting benchmark score.
Benchmark against your own NPS score (The Crucial One)
Reaching the industry average or highest score is something that we can say is at the top of the funnel. However, you can achieve a good NPS or even reach the industry average only if you start at the bottom of the funnel, i.e benchmarking against your own NPS score. It is the most important aspect. It gives you more clarity of things and lets you know how to advance forward. You need to compare your current score with that of the previous one and measure your progress. Your objective should be to beat your own score and progress.
For instance, you can compare your score with the NPS of the last 3 or 6 months. If you see that there is at least 5% growth in your score, then you’ve taken the right path. But do ensure that you have an ample number of respondents and a good response rate.
Now, if you notice a visible decrease in your NPS, then it’s time to act. The reason is that the happy customers are reducing in number and you might be at the risk of losing them. So, if you continuously benchmark your current NPS score against your previous score, you are bound to make amendments in order to make your customers happy, which will, in turn, reflect on your growth.
Golden Rules to Get a Good NPS Score
Now, we’ve come to the final question. ‘How do I get a good NPS score?’. The answers are here.
Benchmark Strategically
When you benchmark your NPS score, first do it against your own NPS, then the industry average, and then strive towards benchmarking against the best in the industry.
Measure NPS on a regular basis
This is a no-brainer. Do you want to improve your NPS? Measure it and analyze your progress continuously to get real-time updates. Now, you need to be very particular about the time at which you send. You don’t want to bombard your customers with NPS surveys every day or week. It could result in a dip in your response rates. So, it’s best to send surveys at regular, significant intervals; like on a quarterly or half-yearly basis.
Did you close the feedback loop? (Again, a crucial one!)
It all boils down to this. You can benchmark your NPS against the industry best, send NPS surveys at regular intervals, and gather feedback, but don’t ever expect to get a better NPS score if you haven’t closed the feedback loop. You need to analyze your feedback, respond to it, take appropriate actions to resolve any issues, and follow up with your customers, be it detractors, passives, or promoters.
Want to set up an NPS survey loop in minutes?
Create beautiful NPS surveys, send them via multiple channels, get AI-powered actionable insights, and close the loop.