Last updated on:
In this digital age, customer engagement is the key to business success. Higher customer engagement can lead to sales growth and better profitability. 65% of consumers say they will remain loyal to the company offering a more engaging customer experience. The question is, what are some of the top customer engagement metrics, and how can they be measured?
In this post, I will outline the top 12 customer engagement metrics, dive deep into each of them, and provide you with the formula to measure wherever applicable. Let’s get started.
Table of Contents
TL;DR
Customer engagement is extremely important for business growth and profitability. It’s about building a long-term relationship with your customers so that they keep using your products or buy from you repeatedly. Here are some of the top customer engagement metrics categorized into specific buckets.
- Measures of Customer Loyalty and Satisfaction: These customer engagement metrics measure how loyal your customers are to your brand and how satisfied they are. The important metrics in this category are Net Promoter Score (NPS), Customer Satisfaction Score (CSAT), and Customer Effort Score (CES). These metrics can be measured after receiving responses from customer surveys.
- Measures of Customer Value: This category of customer engagement metrics measures how much value you get from an average customer, the frequency of transactions, and churn. The key metrics are Customer Lifetime Value (CLV), Churn Rate, and Customer Retention Rate.
- Website Engagement: This category of customer engagement metrics measures how engaged are customers with your website. The key metrics are – Average pages per session, Average Session Duration, Bounce Rate, Conversion Rate, etc.
- Social Media Engagement: The important metrics to measure in this category are the number of comments, questions, and feedback received per social channel.
- Email Engagement: Email is one of the most important channels of communication with your customers. The customer engagement metrics for email are – Email Open Rates and Email Click Rates.
Want to create and send a Customer Satisfaction survey in minutes?
With Affiniv, you can create beautiful surveys and send them instantly via Email or Embed in your website/app.
1. Net Promoter Scores (NPS)
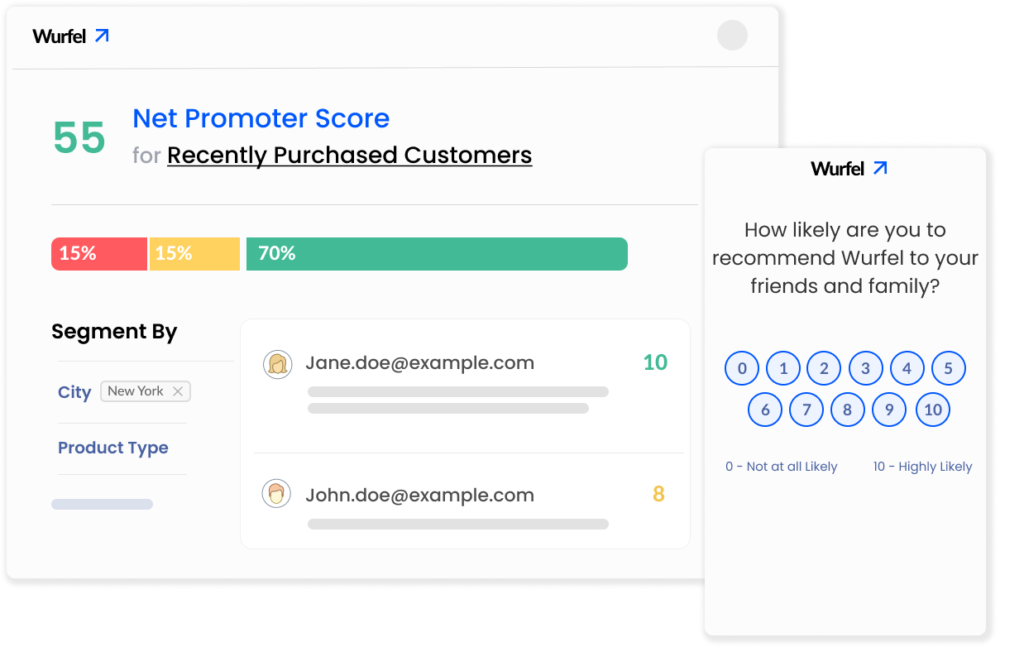
Invented at Bain & co, Net Promoter Score, or NPS is one of the top customer engagement metrics. It measures customer loyalty for your brand, product, or business.
The NPS survey question typically looks like –
How likely are to recommend <your business/product/brand> to a friend or colleague?

The response is an 11-point numeric scale with options ranging from 0 to 10. Customers selecting 0-6 are called detractors, meaning these customers are not happy with your business. They are not likely to buy from you or recommend anyone to your business.
7 and 8 are called passives – these customers are neutral about your business. Customers selecting 9 and 10 are called promoters. These customers are highly engaged and very likely to recommend others.
The Net Promoter score is calculated as (%age of Promoters – %age of detractors).
NPS Formula – (% of Promoters in the Response – % of Detractors in the Response).
An example of how to calculate NPS is as follows. Let’s say 100 customers respond to your NPS survey. Out of them 70 were promoters (Score of 9 and 10), 20 were Passives (7 & 8), and 10 Detractors (0 – 6). In the above example, Percentage of Promoters = 70%, Percentage of Detractors = 10%. So the NPS is (70 – 10) = 60.

An NPS tool like Affiniv can help you create an NPS Survey. You can then send the survey to your customers over email or embed it on your website. Also, you can analyze the result with automatic NPS calculation. To know more, visit this Net Promoter Score page.
2. Customer Satisfaction Score (CSAT)
CSAT is one of the customer engagement metrics, which measures how happy your customers are. For example, let’s say you are into e-commerce business. You can conduct a CSAT survey 10 days after a product is purchased to understand how satisfied the customer is with your product.
You can also show a CSAT survey on your site asking the customer about their website experience. Also, if the customer has raised a query or support issues, you can ask about their experience after the resolution of the same.
Typically, CSAT survey questions look like –
How satisfied are you with the product that you purchased from our site?
The response is a 5-point scale ranging from 1 to 5.
1 – Not at all Satisfied
5 – Extremely Satisfied
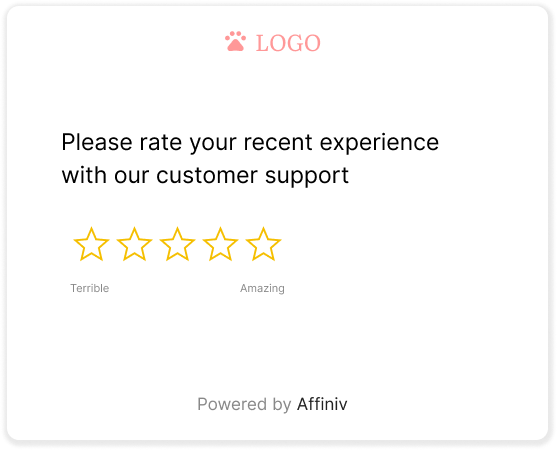
Please rate your experience with our customer support.
Customers selecting 1 and 2 are unhappy or dissatisfied. 4 and 5 are Satisfied.
CSAT score can be calculated as – %age of satisfied or happy customers. Or (Total Number of Happy Customers/Total Number of Customers) * 100
The difference between NPS and CSAT is that, generally CSAT is tied to a particular context – say a transaction. NPS is more generic and can capture the overall customer loyalty.
You can follow this post to understand CSAT vs NPS in more detail.
3. Customer Effort Score (CES)
It was easy to create a return request on the website.The response is a 7-point scale, with 1 being “Strongly Disagree” and 7 being “Strongly Agree”.The CES is the percentage of customers choosing 5 and above (5, 6, and 7). This means the percentage of customers who at least somewhat agree that it was easy to carry out the specific action.
4. Website Engagement - Average Page Views per Session
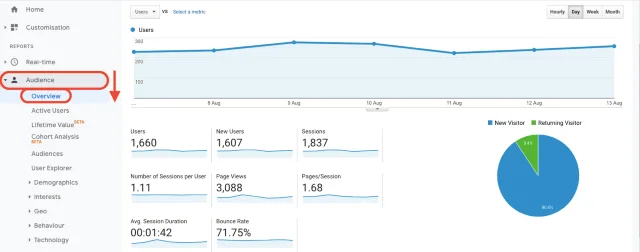
Now that we have seen some metrics to measure customer loyalty and satisfaction, let’s understand how to measure website engagement. Pages per session is one of the top customer engagement metrics when it comes to website engagement.
The formula is – (Total number of Pages viewed for the time period/Total number of sessions during that time period)
If you are using a website analytics tool like Google Analytics, you can find this metric pretty easily. A higher page per session number indicates that customers are engaging with your website better. This can build trust and in turn, can lead to higher conversion.
Here are some ideas to increase the average pages per session.
– Create better and more engaging content.
– Explain the concepts clearly and in simple terms.
– Use internal links to have the user navigate across your pages.
– Have polls and quizzes to keep the user engaged
5. Website Engagement - Average Session Duration
Somewhat similar to the average pages per session, this customer engagement metric measures the average session duration. It can be measured as – (Total duration across all sessions / Number of sessions) for the time period.
If you use a web analytics tool like GA, this metric is pretty easy to find and keep track of. The ways to increase the session durations are similar to the increasing average page views per session. Additionally, you may want to have content like Videos, which can help increase the average session duration.
6. Website Engagement - Conversion Rate
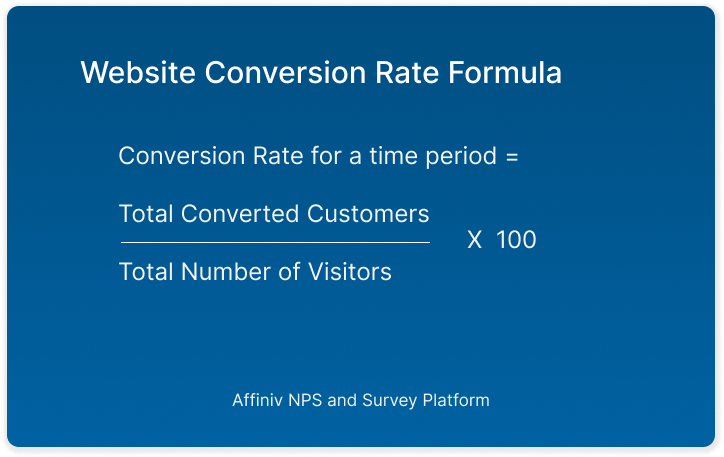
If you are dependent on your website to convert your visitors into paid customers, the conversion rate is a critical metric to measure. Conversion can have different meanings depending on the kind of business. For example – a visitor places an order, or a visitor signs up with your product, and so on. Conversion rate is simply the percentage of customers who converted out of the total number of visitors.
Conversion Rate for a time period = (Total Converted Customers/Total Number of Visitors)*100
Various factors may influence the conversion rate. Here are some ways to think about improving this customer engagement metric.
– Have well-designed and well-tested landing pages
– Clear and simple landing page copy and CTAs
– Add live chat to your site
– Share testimonials and case studies
– Optimize for mobile, if a good percentage of your customers are using a mobile device.
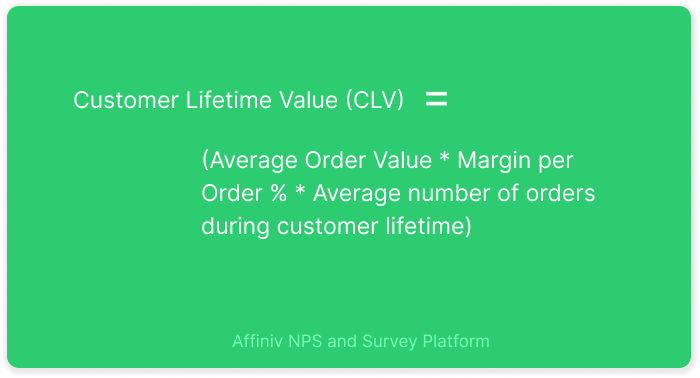
7. Customer Lifetime Value (CLV)
Customer lifetime value simply indicates how much profit or value you are going get out of an average customer over a period of time. You can think of it as all profits across a time period.
Here are 2 examples to explain this concept better.
E-commerce: Let’s say you have an e-commerce business and your average order value is $100. Let’s say your margin per order is 20%. This means you are going to make a profit of $20 out of a single order. If your average customer places 6 orders in her lifetime, then the customer lifetime value is $20 * 6 = $120.
Some of your customers place only 1 order and some others keep ordering every month. But if you are running a business for a few years, you can calculate the average number of orders per customer for a time period. To calculate the same, you can simply divide the total number of orders by the total number of customers placing orders during that period.
SaaS: Here is the way to calculate CLV for a SaaS business. Let’s assume the retention duration for an average customer is 20 months. Average monthly revenue per customer is $100 with a margin of 60%. To arrive at the CLV, you can use the formula – (margin per customer per month * average customer retention duration in months). In this example, the CLV is ($60 * 20) = $1200.
How to increase CLV
A number of variables go into the CLV calculation. Here are some ways to improve your CLV.
- Increase the margin per order or margin per customer. This can be achieved by an increase in the order value. To increase the order value, you can charge higher prices, sell higher-value products, or have more number of items per order.
- Retain your customers for a longer period by offering good products and services. Increasing customer lifetime is one of the most obvious ways to increase the CLV. You should keep measuring and improving the metrics such as NPS, CSAT, and CES.
8. Churn Rate
Churn rate is a very important customer engagement metric for SaaS businesses. It measures what percentage of customers churn or leave in a given time period. The higher the churn rate, you have to acquire more customers to grow. If acquiring new customers is expensive for your business, you should look to retain your existing customers.
Your churn rate in this example is (100/1000)*100 = 10%
In general, the formula for Churn Rate is = (Number of Users left during the period/Number of users you started with for that period) * 100.
Measuring churn rate is essential for a business like Saas, especially for the customer success team. It helps keep the team focused on retaining the existing customers by providing improved products and services. It can also act as a feedback loop for the customer acquisition team. Sometimes higher churn rate may also mean you are not acquiring the right set of customers. Also, some segments like SMBs can churn faster than the enterprise. There is no right number when it comes to the churn rate. It may depend on your product and your customer segment.
9. Customer Engagement Metrics for Social Channels
As a brand, you may be using social channels for various purposes. For example: customer acquisition, getting customer feedback, engaging your users or followers, providing updates on new releases or offers, etc. Here are some metrics that may be relevant for social channels.
- Post-wise Engagement: You can measure likes, shares, impressions, comments, etc per post. You can also classify these numbers according to the type of post. Done frequently, this can provide insights into the kind of content that your user base is engaging with.
- Number of tickets created or feedback received per month: If your customers are active on your social media channel, you will get feedback, support tickets, etc.
10. Customer Engagement Metrics for Email
Like most businesses, Email could be the top channel for customer communication for your business. To keep your customers engaged with your business, you may be sending periodic newsletters, updates on new launches, feature updates and releases, offers and discounts, etc. Monitoring customer engagement over email is crucial for several reasons. When it comes to Email engagement, here are the top metrics.
Open rate: Open rate is calculated as (number of emails opened at least once/number of emails sent) * 100. This can be calculated for a particular period or particular content type. For example, you can measure open rates for your cart abandonment email, or your monthly product release email.
If you are using an Email marketing tool like MailChimp, metrics like open rate and click rate should be available to you upfront for every campaign.
A healthy open rate is an indication of good customer engagement with your email content. If your open rate is not good, there can be several reasons.
- Your emails are landing either in folders like spam, promotions, etc. This can happen due to incorrect domain configuration. You should check for domain configurations like DKIM, SPF, etc., and make necessary modifications.
- Your content may not be very relevant to the target audience. you should try more relevant content by checking which content types have better engagement or what are your audiences looking for.
- Your subject lines need improvement. Users look at your subject line before deciding whether to open an email. If some of your campaigns have low open rates, it means you may need to improve your subject lines. You can also try doing A/B tests or use subject line evaluation tools.
Click Rate: Click rate formula = (Number of Emails where at least 1 link is clicked/Total number of emails sent) * 100. Email opening is the first step, but it is the click that truly matters for most types of emails.
If you use a tool like MailChimp to send emails, you can get the click rate for every campaign. A high click rate indicates your content is highly relevant to the audience.
- Content should be relevant to your audience. Not every content will be suitable for all your users. In that case, you should send the content only to the relevant segments.
- Use clear and simple language.
- Use a well-designed template. It should be responsive so that it renders well on mobile devices.
- Have clear CTAs
11. Measuring Average User Activity
For businesses like SaaS or mobile apps, measuring user activity can be critical to measuring the level of user engagement. There are several tools like Mixpanel, Google Analytics, Hotjar, etc, which can track user activities like login, inviting users, using certain features, etc. An average activity score can be created per user and tracked every month.
Average user activity can be measured as (Total number of activities/Total number of Users). This can be extended to the account level as well. For example, accounts can be ranked based on their activity. The accounts with the least number of activities can be identified to be at risk of churn.
Benefits of Tracking Average User Activity:
- This can lead to better product usage and continuous product improvements. For example, a lower user activity score should lead to introducing more relevant features and using better UX for the existing features.
- Accounts at risk of churn can be identified by tracking the user activity numbers for the account. The customer success teams can then take action based on the score.
Conclusion
In this post, we have seen various customer engagement metrics, the benefits of tracking them, and how to measure each of them. You may not choose to measure and track each of these metrics to begin with. You can start measuring the ones that are the most relevant for your business and put the tracking in place. Once you cover your core metrics, you can then move towards implementing the others.
You can use a customer experience tool like Affiniv to track customer loyalty metrics like NPS, CSAT, and CES. With Affiniv, you can create a survey, send the survey using email, embed it on your site, and analyze the responses on the dashboard.
Want to create and send a Customer Experience Survey in minutes?
With Affiniv, you can create beautiful surveys, and send them instantly via Email or Embed on your website/app.


